Bitcoin Market Intelligence - Issue #20 - Bitcoin halving cycles
Hey everyone,
Today, I will give a short overview of Bitcoin halving cycles, where we are now and how it stacks up relative to previous cycles. While, of course, macro is the dominating topic and highly relevant for current price developments, it is interesting nonetheless to have a look at how well or not well it fits previous cycles.
——————> Zum Deutschen Newsletter geht es hier. <——————
What are halving cycles?
The Bitcoin halving event is a recurring event that occurs every 210,000 blocks, or roughly every four years, in the Bitcoin network. During this event, the number of bitcoins awarded to miners as a reward for verifying transactions is reduced by half. That way, with each cycle, less and less bitcoin, are brought into circulation. The halving cycle has been coded into the Bitcoin protocol and will continue until all 21 million bitcoins have been mined (technically slightly less, but that’s not relevant here). Currently, 6.25 bitcoin are discovered in each block roughly every ten minutes. That reward will drop to 3.125 bitcoin at the next halving event, which is currently projected to be in May 2024.
These halving events are believed to be price drivers for bitcoin as fewer new coins have to be absorbed by the market. Some argue that halving events are already priced in, with market participants anticipating and trying to front run these events. However, considering how few people e.g. understand the difficulty adjustment of bitcoin and how many misconceptions about bitcoin are out there, even in the financial world, I don’t think this is true. While some front running might occur, awareness of these cycles has yet to become more widespread.
Further, with more and more bitcoin already being discovered and in circulation and the halving of the rewards each cycle, the selling pressure from that side is diminishing over time relative to bitcoin already in circulation. So, the relevance of halving cycles for the price should diminish over time.
For instance, in the previous cycle, 1800 bitcoin have been mined each day, in the current cycle 900. This will drop to 450 bitcoin in 2024.
These are factors to consider on how much weight should be put on halving cycles.
Some argue that halving cycles coincide with general business and financial cycles and that it is not necessarily the halving cycles that are bullish for bitcoin’s price.
Also, the increasing occurrence of professional mining companies that have easy access to capital markets may reduce immediate sell pressure if miners can wait for better market conditions (higher prices, higher liquidity,…) to sell the mined bitcoin and cover their operating costs.
Whether halving cycles matter and, if so, by how much is open for debate, and I will let you decide for yourself.
Halving cycles in comparison
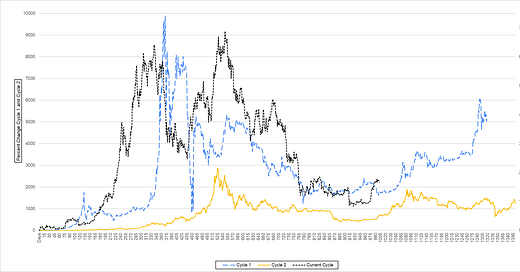
As of today, we are 1003 days into the 3rd halving cycle.
This cycle has been rather disappointing in terms of price performance compared to the previous two.
As cycle one really sticks out in terms of price performance, this cycle’s price moves are barely visible. Thus, for better visibility reasons, cycle one has been moved to the right-hand scale.
But for perspective, you can see the previous two cycles and the current cycles’ price performance since the halving on the same scale in the Appendix.
What sticks out is that in the current cycle, bitcoin did not have a blow-off top but rather a double top. During the previous two cycles, we see two rather clear tops sticking out. The changing macro landscape and the increasing involvement of institutional investors, which lead to an increased correlation of bitcoin to traditional financial markets, may be reasons for that.
The days until the all-time high from the halving date of the current cycle are not too far off from that of the previous cycle (549 days vs. 527 days).
What is more interesting is the timing of the most recent price recovery, where bitcoin recovered some of its losses made so far. While compared to the previous two, it may be a bit earlier, it is rather close to the starting dates of the previous two cycles’ recoveries.
For completeness reasons, in the Appendix is also a comparison of the first years or Genesis cycle, as I like to call the cycle before the first halving event. The graph is in USD terms as in the early days, there was no price attached to bitcoin. This is one of the many reasons a comparison is not as interesting here.
Arguably, the recent price moves to the upside have likely to do with market participants anticipating a Fed pivot or treating the slowdown in rate hikes and a potential stop in rate hikes as positive warranted or not. If it is due to participants anticipating a near-term pivot, you may have noticed that I am rather leaning towards it not being warranted, but the stop in hikes is pretty much a given some time in the coming months, to my mind.
Will history rhyme, and what we see right now is the start of a recovery like in the previous two cycles? Only time will tell.
Jan Wüstenfeld
If you found this newsletter insightful, don’t forget to subscribe and share it. You would make my day! :-)
————————————————————————————
This content is for educational purposes only. It does not constitute trading advice. Past performance does not indicate future results. Do not invest more than you can afford to lose. The author of this article may hold assets mentioned in the piece.
Appendix


